What is The Great Grading Scale (TGGS)?
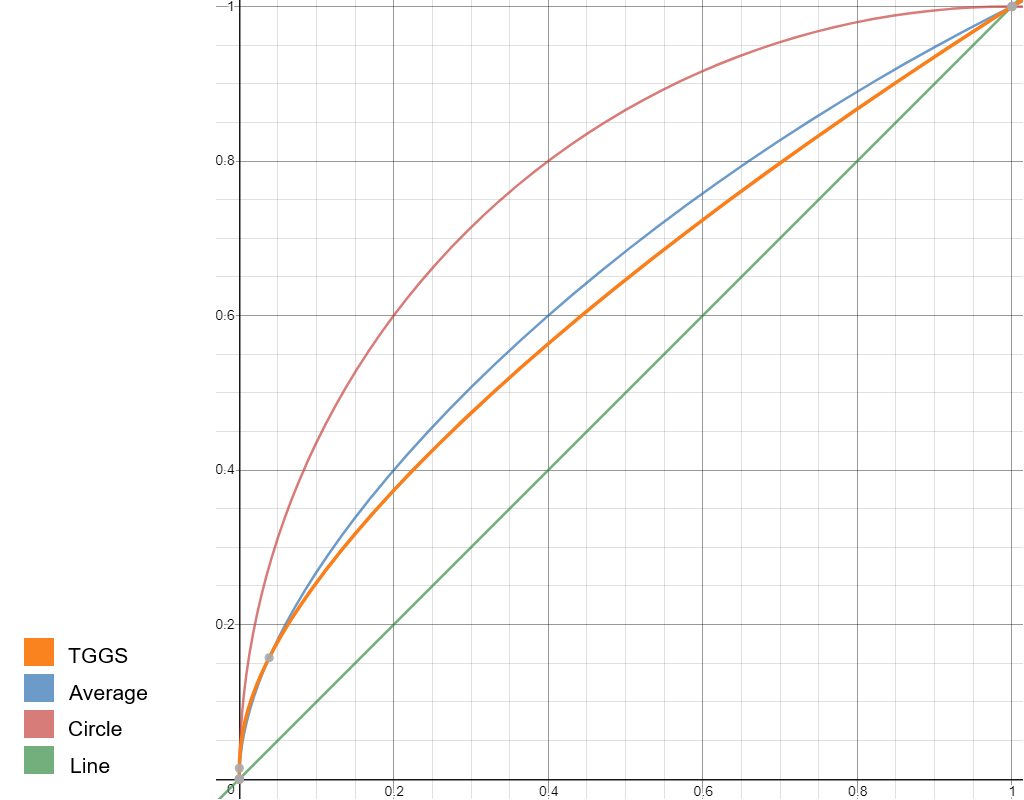
TGGS is a near-perfect grading scale, that allows you to easily and fairly balance grades for your students, while continuing to challenge them with difficult tests. The image below explains this well:
Red: Arc of circle through (0,0) and (1,1); center: (1,0)
Blue: Average of red and green, the perfect curve
Orange: TGGS, which approaches the perfect curve
Green: Don’t skip math class, kids
How to grade on a curve: What’s a Teacher to do?
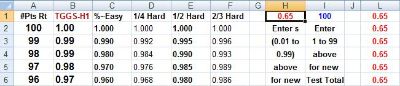
What is the best grading curve that transforms a mean of 68% to 78%? The Great Grading Scale(TGGS) uses a grading curve spreadsheet to execute “how to grade on a curve” when percent test scores need a curve other than a standard bell curve. Often, percent scores from a challenging test demand that some adjustment be made in order to be fair to the students(some require modifications) and to conform to a school’s expectations. TGGS is described and offered for professional use when cumulative or hard/challenging tests are evaluated from percent scores. When “help” is presented, what’s a teacher to do but “to try it.”
A Grading Curve Spreadsheet: think about it!!!
Pretend for a moment that you are an academic teacher in the secondary or college arena. You have just performed the best teaching that can be modeled for your class. You schedule a test and look forward to the best performance that students can produce. After grading the 20 items, including 4 items worth 3 points each, you end up with a test total of 28 points. Because you had felt so confident about your teaching, you decided to design a challenging test or use one from the teacher’s kit provided by the textbook publisher. Each test item, or sub-part counted 1 if completely correct, 1⁄2 if nearly correct, or 0 if less than 2⁄3 correct. The average score was 69.5%; the high score was 94% and the low score was 36%. What’s a teacher to do? The test was, clearly, a reflection of the material covered, but it was, admittedly, challenging. Too, some of the students did not complete it within the time allotted. If graded on a percent basis in which the scores yielded 2 A’s, 4 B’s, 7 C’s, 5 D’s and 6 F’s, how does a teacher fairly redistribute the grades and stay true to a legitimate mathematical model?
What’s a teacher to do but try!
Try the TGGS 100 point grading curve spreadsheet. Why?? Because no score exceeds 100, students are treated fairly; school expectations are maintained; and record-keeping tasks are easily performed. By using the great grading scale, the adjusted mean will be 78.5; the high score will be 96 and the low score will be 51. After an item analysis, you will be able to provide re-teaching that will increase student learning. What a way to meet the needs of your students and show mercy at the same time! As an option, based upon your knowledge of your students, you may try the 100 point table and adjust with the square root scale(x^.5) or the cube root scale(x^.35) or change the s-value(.56) for the perfect curve.
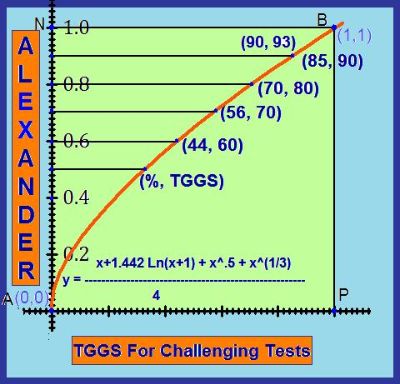
Initially, TGGS was defined as the average of four curves that pass through (0,0) and (1,1). TGGS seems to adjust any percent score (x) reasonably whenever a challenging test has been administered. With creativity, TGGS can be customized to meet a wide variety of needs and it may be the most flexible and usable tool for transforming percent scores in existence today; furthermore, TGGS very well may touch the hearts of students.