How to Use The Great Grading Scale (TGGS)
Step 1. Give a hard test and grade it on the percent scale. Examine the data and get sick & tired and disgusted with the % scores.
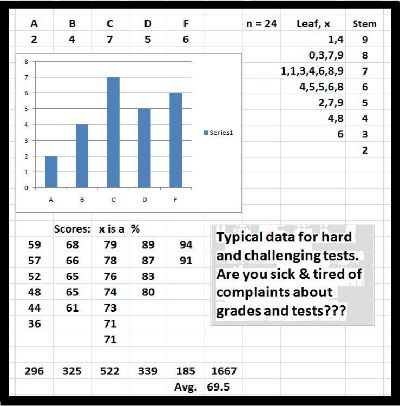
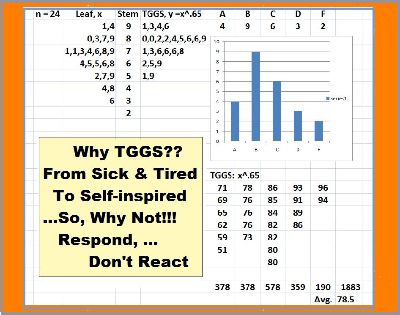
Step 2. Use a grading curve spreadsheet to transform test data from hard and challenging tests. From above to below: Use TGGS:
$$t = x^{(.65)}$$
Step 3. Does this do the job?? If not, try:
$$x^{(.5)}$$
or:
$$x^{(.8)}$$
and ponder; does this do the job?? Look at various statistics and compare.
Step 4. If not, customize the grading curve spreadsheet template by changing the s-value until the job is delivered to your satisfaction. How to calculate a new s-value:
A TGGS value, t, is determined when a % score, x, is raised to the s power, that is, t = x^s; and this implies that ln(t) = s(ln(x)) or s = ln(t) / ln(x). From the sample above, four statistics are used to calculate a new s-value(use a scientific calculator):
a) To change the hi score, 94, to 99, s = ln(.99)/ln(.94) = .16(or simply use column G, where s = .2).
b) To change the mean score, 69.5, to 82.5, s = ln(.825)/ln(.695) = .53(or simply use column C, where s = .5).
c) To change the median score, 71, to 78, s = ln(.78)/ln(.71) = .73(replace .65 with .73 in column H).
d) To change the low score, 36, to 55, s = ln(.55)/ln(.36) = .59(replace .65 with .59 in column H).
e) To change the minimum passing score from 60 to 80, s = ln(.60)/ln(.80) = 2.29 for competency or mastery testing, if you dare!
Step 5. Last, review and correct the test; this validates that student growth & improvement after the test merits the adjustment.
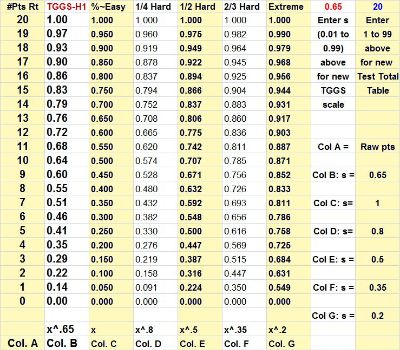
Grading Curve Spreadsheet with 15 Points Total
Possible Total Points: 30, 45, 60, 75, 90
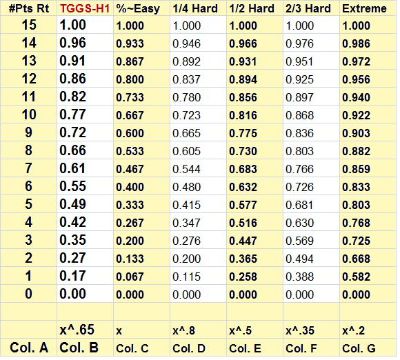
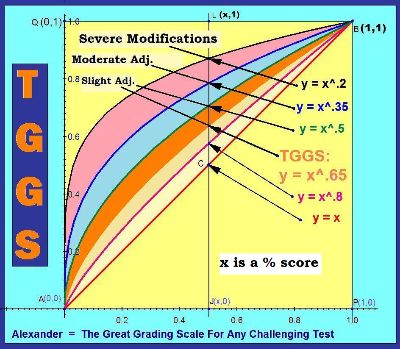
Evolving, simple TGGS formulas emerge from y = x ^ s where x is a percent score and s is a test difficulty index with 0 < s <= 1.
Make no Mistake: TGGS Builds Trust!
This TGGS website is not about inflating grades! When students require test modifications, TGGS offers reasonable options without redefining each test; simply, choose the appropriate grading curve for the individual learner with specific needs.
Grading Curve Spreadsheet with 20 Points Total
Possible Total Points: 5, 10, 40, 60, 80, 100
Evolving, simple TGGS formulas emerge from y = x ^ s where x is a percent score and s is a test difficulty index with 0 < s <= 1.
Make no Mistake: TGGS is one of six options
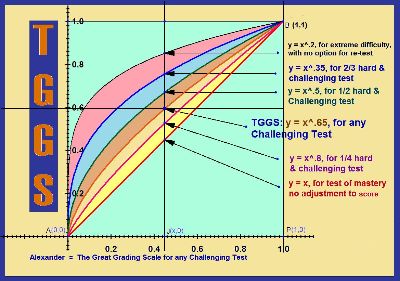
The purpose of this website is to encourage academic teachers to stimulate the curriculum by teaching more and expecting more from students, as shown by the results from hard and challenging tests. So, what’s a teacher to do? To explore and use the scale that best guards and protects serious and caring students from despair and humiliation is the least that any teacher should do to fairly evaluate students.
For differentiated instruction, the following s-values may apply:
T1 (Not Yet Ready): Use s = .35 or .50 or .65
T2 (Ready): Use s = .5 or .65 or .8
T3 (Ready To Grow): Use s = .65 or .8 or 1
Grading Curve Spreadsheet with 24 Points Total
Possible Total points: 6, 12, 48, 72, 96
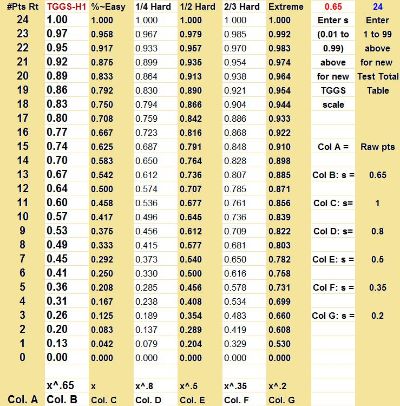
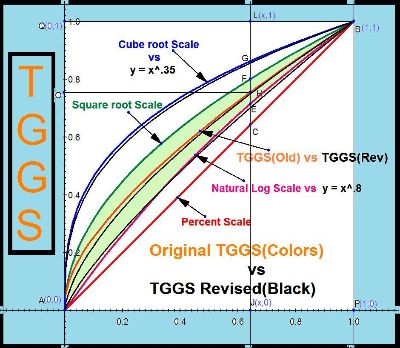
After much exploration, TGGS was revised to y = x^s, 0< s <= 1, where s = 1, s = .8, s = .65, s = .5, s = .35 & s = .2 (Obviously, the revised curves are very, very close to the original curves but much easier to express.)
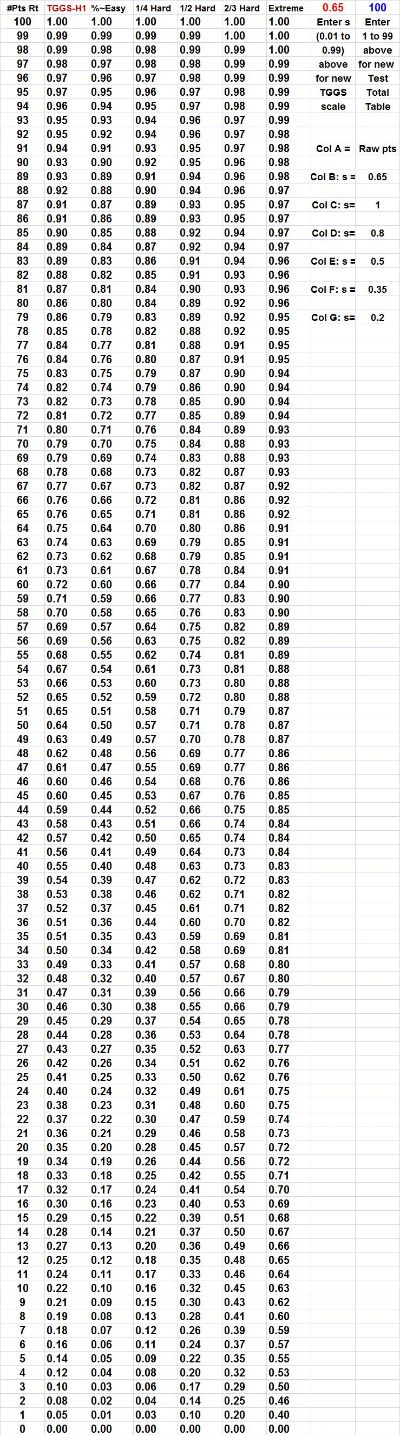
Grading Curve Spreadsheet with 100 Points Total
To customize, replace 0.65(Col. H) with a new s-value and/or replace 100(Col. I) with a new test total value.